EOS M5: ISO Noise vs. Effective Resolution
Noise in digital cameras adversely affects image quality by obscuring fine details and consequently reducing the effective resolution of the camera’s sensor. In this line of tests I’ll be showing the visual affect of camera noise on image resolution by photographing a resolution test wedge and showing the results.
This is the 3rd edition of this kind of article looking at noise and the effect on resolution in digital cameras. My first looked at the EOS 5D mark III and my second looked at it’s successor the 5D mark IV. This will be the first time I’ve done this for a APS-C camera from Canon.
The test unit for this article was the EOS M5. The results should be identical for the M5’s twin the EOS M6. Moreover, the very similar, 24.2 MP dual pixel architecture sensor is also used in the 80D, 77D, T7i, should see similar performance.
As with my previous tests, these tests were done with an EF 70-200mm f/4L IS USM lens, and using my custom camera acclimation test chart.
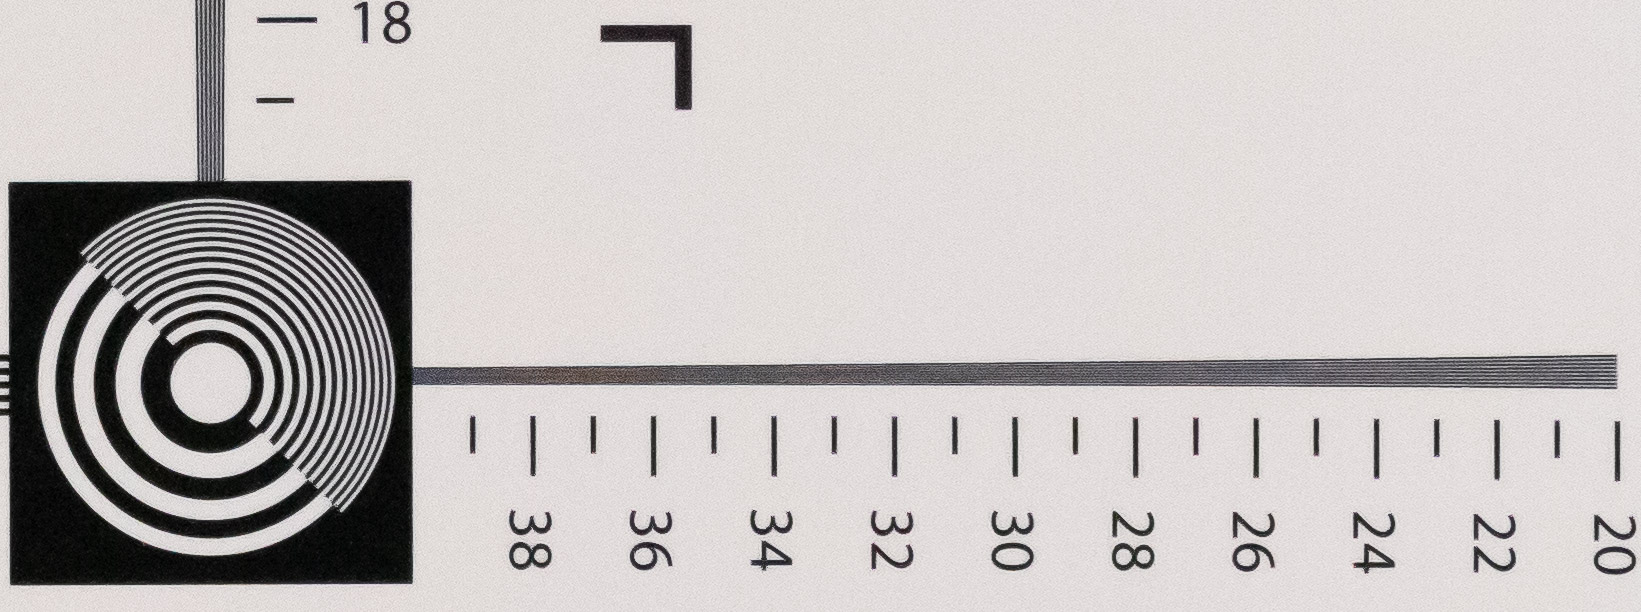
ISO 125
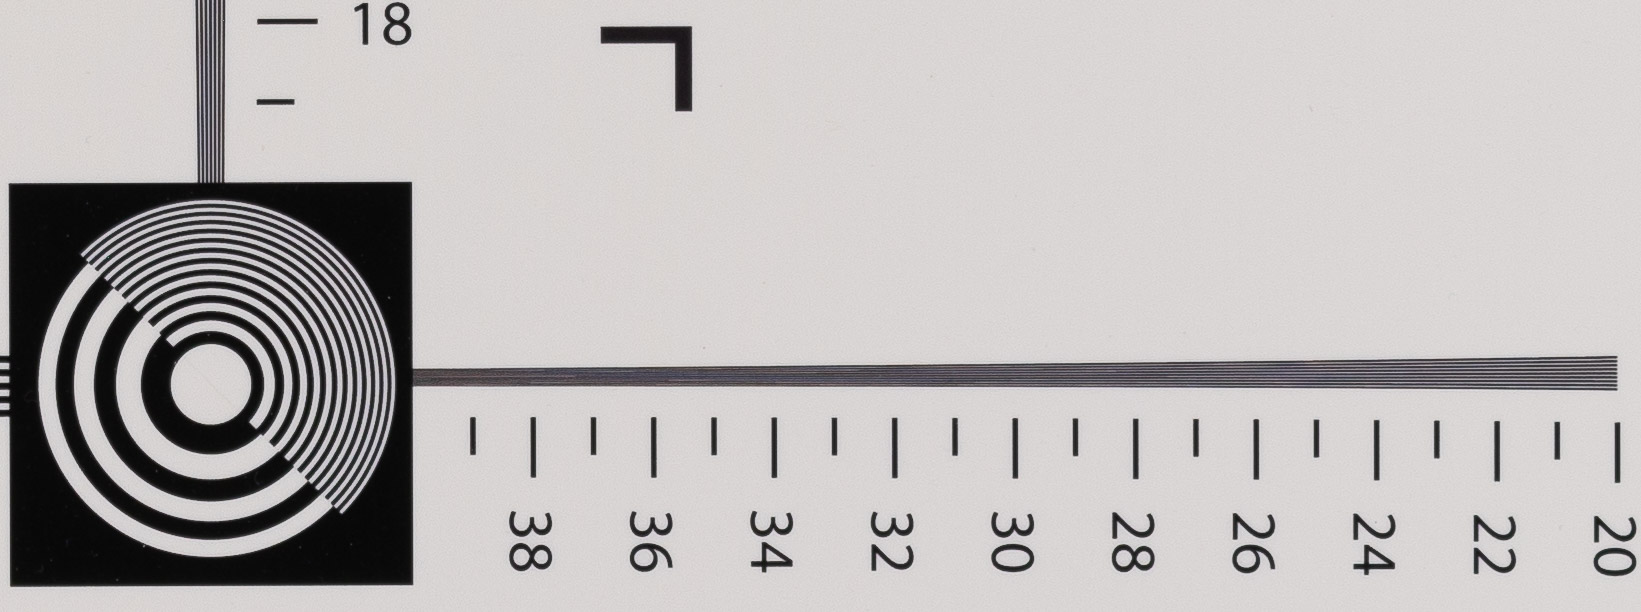
Normally I start with the ISO 100 results. However, my ISO 100 results were blurred due to camera shake, and I didn’t realize that until I had already taken the test setup apart.
Due to printing limitations, my test chart doesn’t provide useful data above around 2800 ln/ph, or about 12 MP.
In my interpretation of this image, I would say that the camera and lens combination is resolving around 2600 ln/ph, though it might be more.
That said, while lines per picture height are sensor format agnostic, I would point out that it’s not a good idea to attempt to compare these results to my earlier full frame camera results. These tests are done with the sharpest lens I own, an EF 70-200mm f/4L IS USM, at the smallest aperture that isn’t diffraction limited; in this case, f/5.6. However, the full frame tests were done at f/8 where the lens is appreciably sharper.
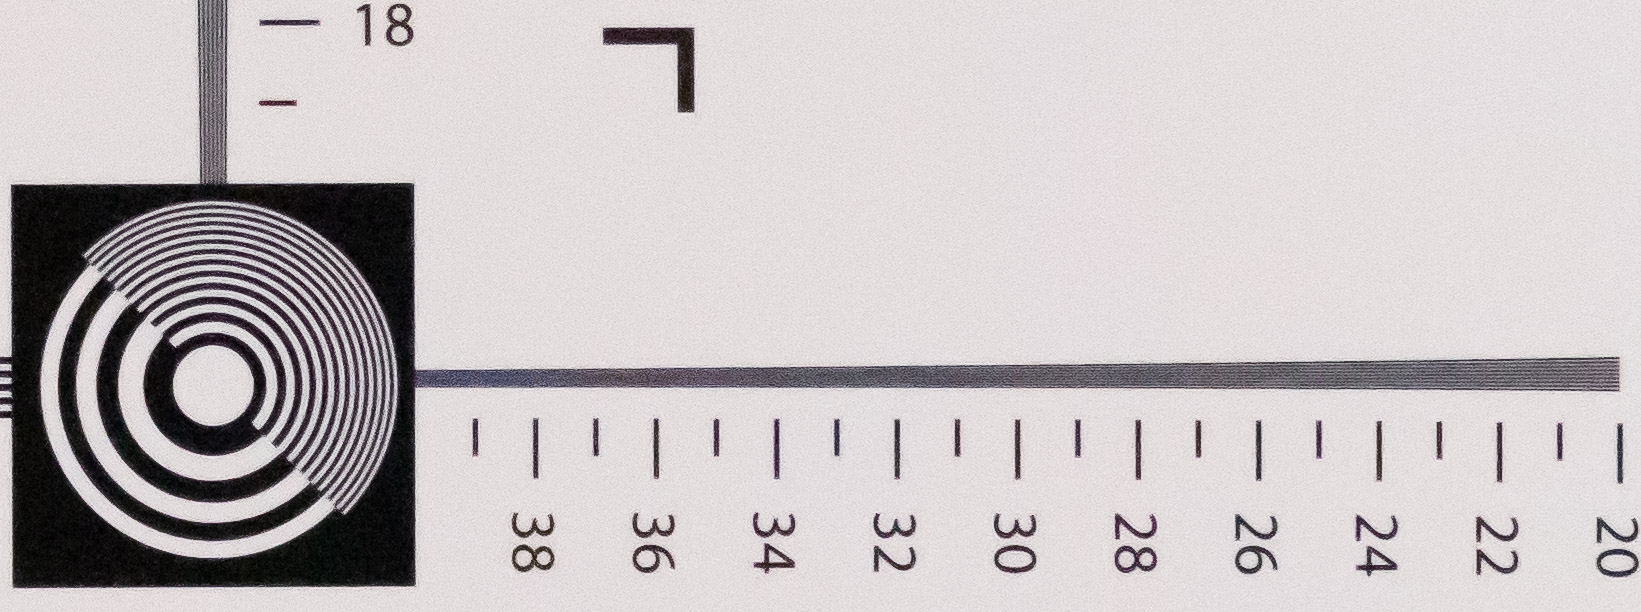
ISO 200
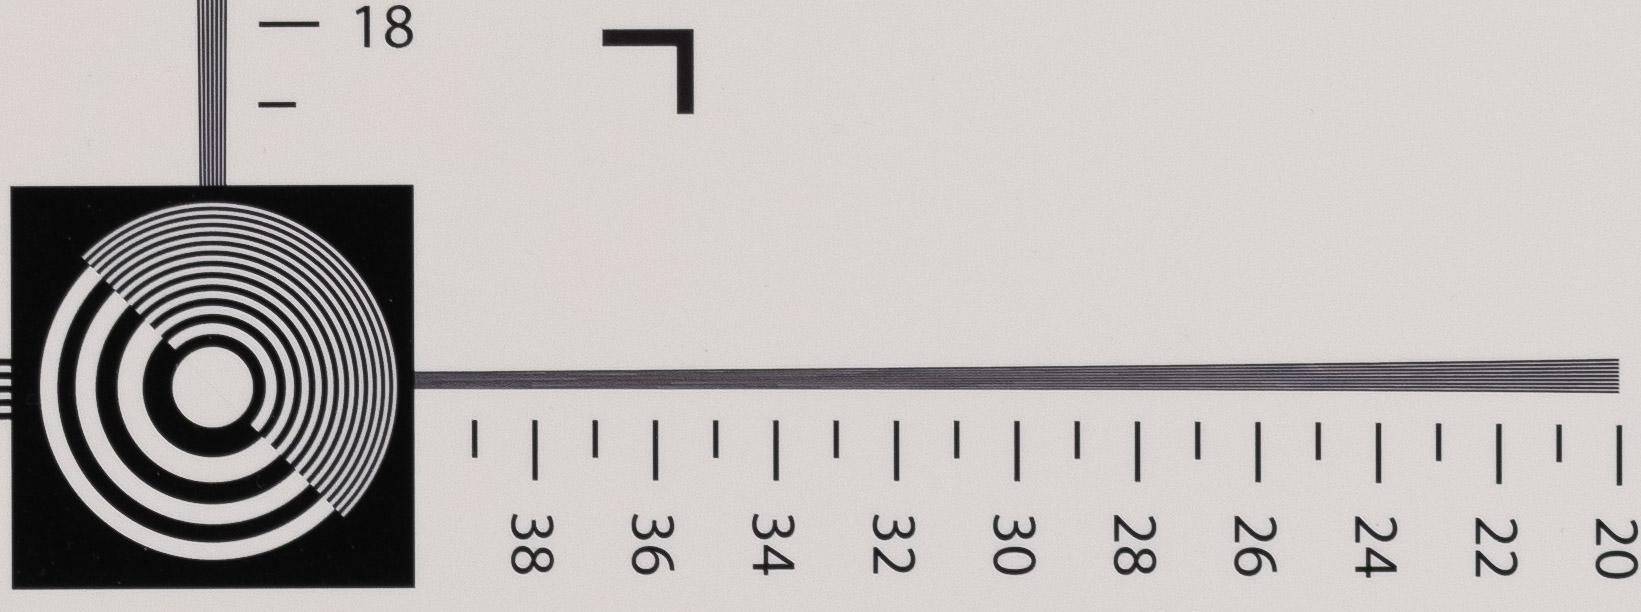
At ISO 200, there’s a slight but perceptible decrease in apparent resolution. By my eye, it’s dropped from the 2600 ln/ph at ISO 125 to something more in the 2400-2500 ln/ph range.
However, it’s entirely possible that like the ISO 100 image, this is anomalous due to camera vibration at the 1⁄25 shutter speed. At shutter speeds between about 1⁄2 and 1⁄60 give or take, images are more sensitive to subtle impacts from camera induced vibration and mirror slap. For these tests to retain a consistent lens sharpeners, the aperture is fixed, and the ISO and shutter speed is changed; this means that there will always be images produced in the range of maximum vibrational vulnerability.
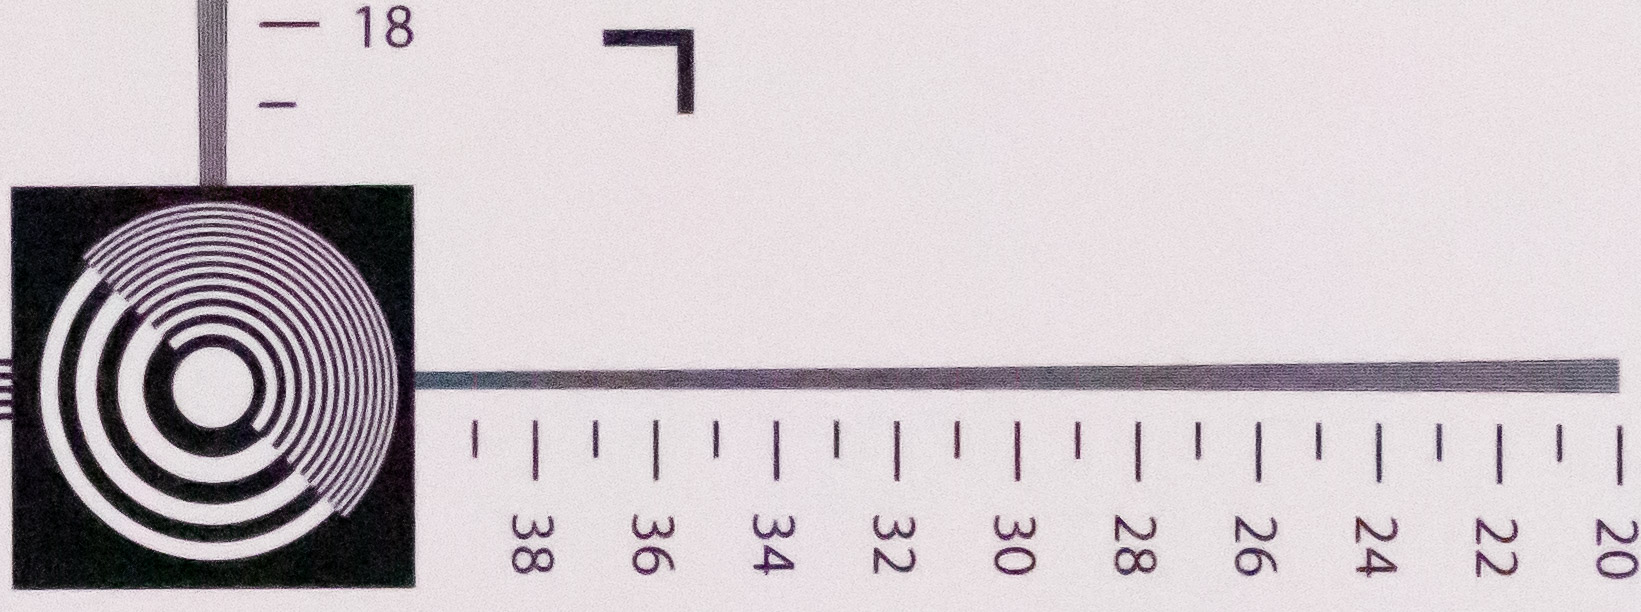
ISO 400
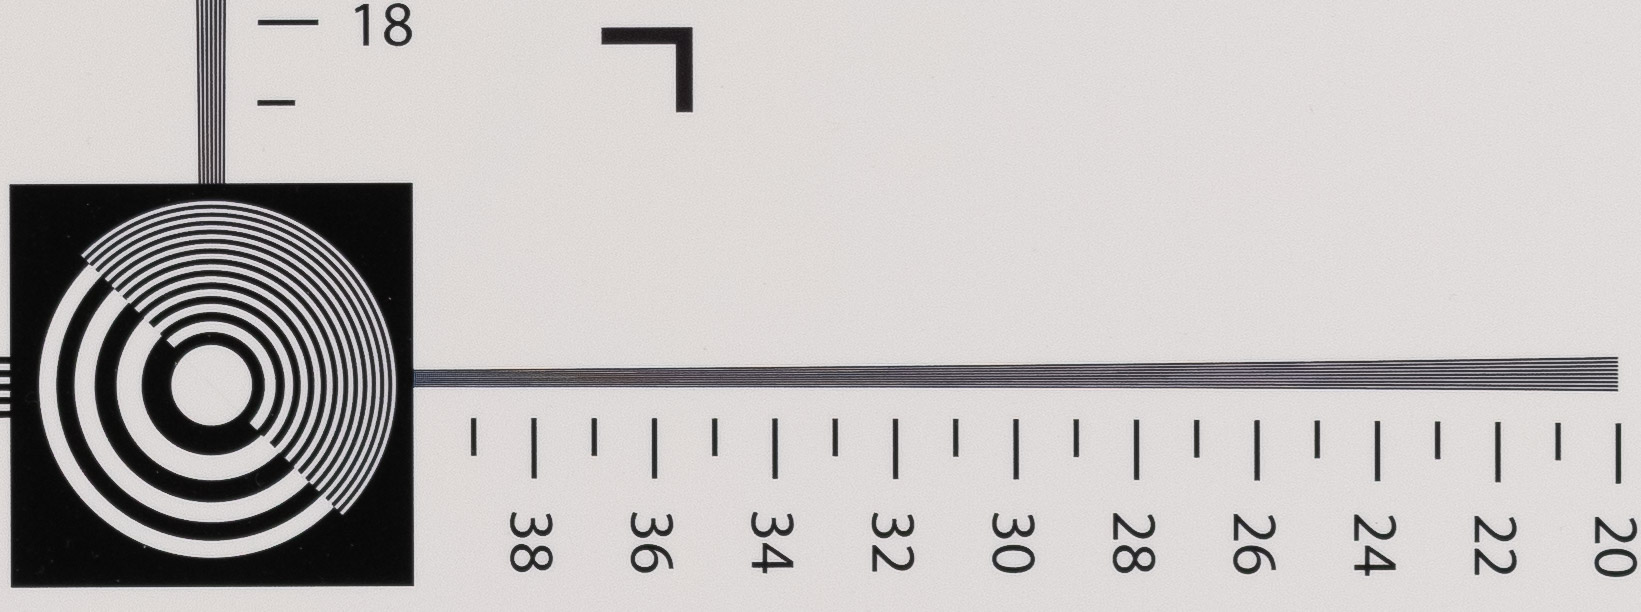
The image made at ISO 400 provides a very crisp result. With a shutter speed of 1⁄50, it’s on the very edge of the vibration vulnerability region, but clearly not being impacted here. I read this easily as 2600 ln/ph (10 MP) to 2700 ln/ph (11 MP). Though this is also very close to the limits of my test chart, as well as potentially the limits of the lens I’m using for testing.
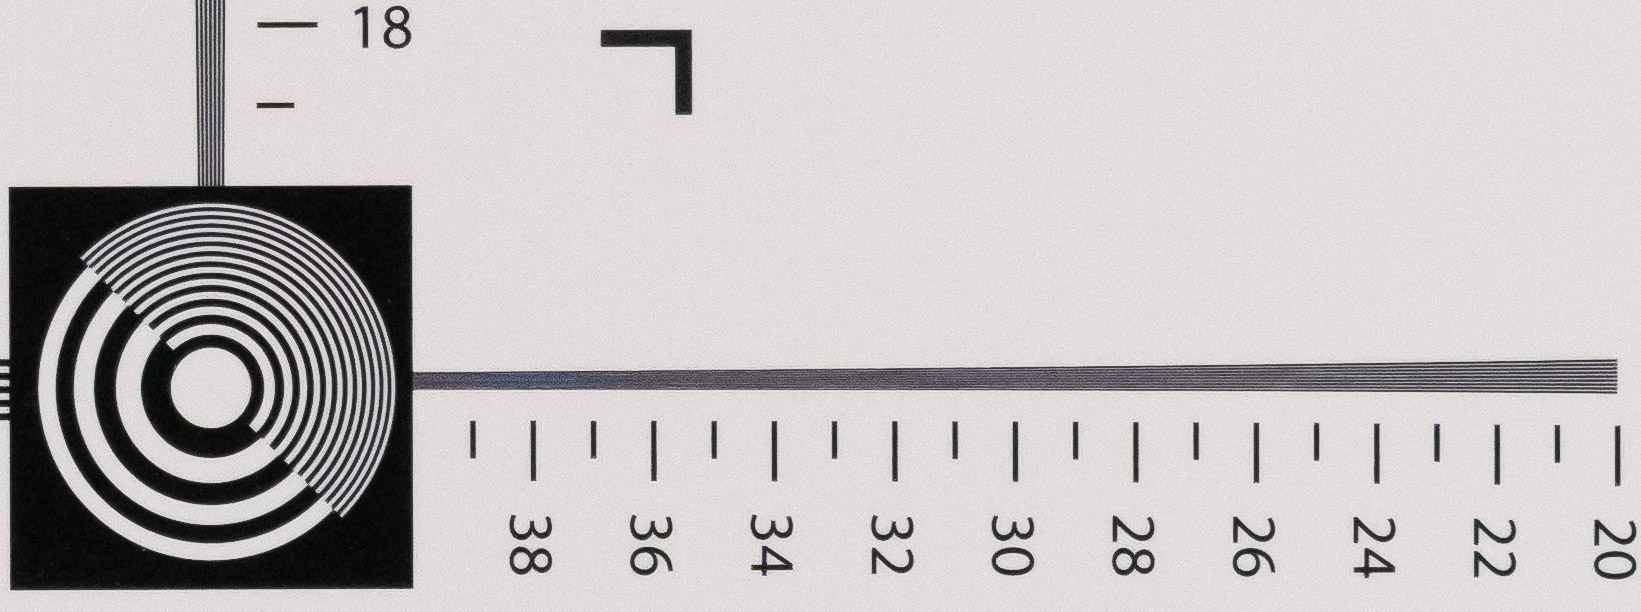
ISO 1600

At ISO 1600 we get into what I would consider by modern standards the mid ISO range. Lots of images will likely be made around this range when shooting indoors, especially with the generally slow f/3.5-6.3 EF-M lenses.
To my eye at ISO 1600 the M5’s sensor is holding up pretty good. While noise is becoming more obvious, I see good distinction in the lines at around 2400 ln/ph (8.6 MP) and 2500 ln/ph (9.3 MP).
At this point, the limitations and challenges of a high resolution APS-C sensor should start to become apparent, at least when compared to a full frame sensor. On my 5D mark IV tests, the camera was still holding 2800 ln/ph at this ISO. That said, ISO 1600 is still perfectly usable by any standard.
ISO 3200
In increasing the ISO another stop to ISO 3200, the noise is starting to become clearly apparent in 1:1 viewing. By my eye, the I would call the resolution chart out at 2300 ln/ph (7.9 MP) to 2400 ln/ph (8.6 MP).
While I might not want to make fine art prints from images at this ISO, I would still consider the images pretty usable. 8 MP is the resolution of an 8×10 print at 300 PPI.
ISO 6400
At ISO 6400, the noise is very obvious in the image as a whole, and especially obvious in the 1:1 viewing of the resolution wedges. To my eye, I read this as about 2100–2200 ln/ph (6.6–7.2 MP).
While there’s certainly noise in the image, I’m actually somewhat impressed by the performance of the sensor here. As a whole, the image is still quite good, and the 24 MP sensor means that the noise is fine-grained enough that it shouldn’t be overly distracting in a lightly cropped print.
ISO 12,800
By ISO 12,800, the M5’s sensor is getting into the region where I consider the images good for when having the picture is far more important than having a good picture. Noise is really doing a number on the resolution, which I read as about 2000 ln/ph (6 MP).
ISO 25,600
ISO 25,600 is the maximum ISO of the EOS M5. On one hand, the image from this ISO is still usable, and the content is still clearly discernible. My interpretation of the test chart is that the resolution is around 1800 ln/ph (4.8 MP).
While this isn’t what I would consider acceptable for fine art images, down sampled versions of lightly-cropped or uncropped images would be noisy but perfectly adequate for display on mobile phones or websites; especially in reportage situations.
Conclusions
All told, I’m somewhat surprised and quite pleased with the performance this sensor put up in this test. While I have no intention to hand in my full frame 5D mark IVs, the M5 put up what I consider a quite good showing.
At low ISOs, performance was good enough to make my test chart and lens a limiting factor. In the mid ISO range (1600-6400) the performance still held on, though it’s probably lower than I would consider acceptable for fine art work. Even in the high ISO range the images were still clearly discernable and intelligible.
Comments
Thank you Jason for putting this together. I don’t see much in your pictures but i find the information valuable. It’s great to know where to stop for what you’re printing.
Your welcome.
The differences are more evident if you click on them and see them at 1:1 magnification.