An Assessment of the US Full Frame Camera Market prompted by Sony’s Press Release
Back in the beginning of April (2017) Sony USA put out a press release[1] announcing that for the months of January and February they had taken the number 2 spot for full frame camera sales in the US. Needless to say, the photography press (and photo blog-o-sphere) ran with this, with many seemingly citing it as evidence to support a narrative that Canon and Nikon are clueless and Sony isn’t.
On a related note, I also recently wrote about the lack of data and problems that causes when it comes to talking about camera gear, sales, and features. One of the biggest of those problems is that without clear data and context, it becomes hard if not impossible to identify outlying events, and, more broadly, outliers can be made to fit pretty much any narrative an author chooses.
This article is the result of well, lets be honest, Sony’s press release raised some questions for me and I started digging into whatever information I could find as best and accurately as I could; which raised even more. None of which I think I really answer completely, but then that really wasn’t the point of this kind of exercise for me anyway.
I don’t have any vested interest in any particularly result, though many certainly do. However, as I said in my previous post on bias, without any kind of data and contextualization it’s hard to make sound judgments. While I don’t have tons of hard data, I do want to look what data I can find, and other market factors that may have been at play.
Moreover, the media and blog-o-sphere’s response to this struck a cord me with me. Sites like DP Review (though I’m certainly not singling them out) have far more in the way of resources to talk about and add context to a press release this, at least compared to someone like me. I don’t have a budget for review gear, sophisticated test benches, and most certainly I don’t have the readership and pull to be able to go to a camera manufacture and ask for clarification on press releases that aren’t clear to me. But this kind of research doesn’t get done, because it’s not as shiny and profitable as posting a fluffed up article about the newest camera that’s been announced; so it doesn’t really get done.
So let met preface this article with this. There is a lot of speculation in this article. Most of this speculation is based on hard data, but not always the data I’d like it to be. I do talk about my assumptions and where I get things from. All told I’m probably going to raise more questions than I can answer, but ultimately this is intended to be food for thought, perspective if you will, not a rebuttal or refutation of something.
Broadly speaking, there are a number of points that I think are worth of investigation here.
- How big is the volume of full frame cameras in the US market as a whole?
- How do rebates affect high end camera sales?
- How did Sony account for the rebates they were running over the time of the press release?
- How do sales of full frame cameras fluctuate with the time of year?
- How does product maturity affect the sales of high end cameras?
Full Frame Sales Volume (in the US Market)
Let’s start by looking at and potentially estimating the volume of full frame cameras sold. I think, that for a lot of photographers commenting on camera sales, and the industry as a whole, there’s not a real clear appreciation for just how small the camera market is. Further, in this case, we’re talking about a niche (full frame cameras) within a niche (high end cameras) within a single specific market (the United States alone).
To put some perspective on the actual volumes, considered this. According to the CIPA shipments figure, combined all the reporting camera companies[2] shipped[3] 153,775 interchangeable lens cameras to the Americas (Includes all of North and South America plus the Caribbean) in January. That same month, Ford sold 120,400 vehicles at retail (they sold a further ~58,000 to fleets) in just the US alone[4]. Ford is just one car company, while the CIPA numbers cover all the major small format camera manufacturers.
In the following sections I’m going to attempt to build a reasonable estimate for the number of full frame cameras shipped/sold in the US, and ultimately on a per manufacture (Canon, Nikon, and Sony) basis. This should be considered at best a first order estimation, and not anything approaching actual hard data. My intent here is to build a feel for the size of the market, since ultimately that tells us a lot about how difficult it may be fro one brand change positions with another.
Virtually every step of the following derivations is riddled with assumptions due to the lack of hard data. I’ve tried to lay out my reasoning for the assumptions as best I can, and I’ve cited what sources I have for the data itself.
Further, I’m going to make two sets of estimates. One is based on January 2017 shipments, and one is going to be based on a simple average of 2016 total annual sales. I’m doing this because camera sales as a whole right now are changing rather significantly year to year. Plus recently we’ve seen large scale disruptions (Sony’s fab being destroyed) and other knock on effects that may not be reflective of larger scale trends.
2016 was a rather bad year for camera sales, however it’s not clear that all of it was due to a lack of interest (as is frequently asserted to be the case online), a lack of supply, or other more specific issues related to specific manufactures and models.
For example, on the supply side of things, Sony’s main large sensor fabrication plant was seriously damaged and out of service for several months. This plant, in addition to providing Sony with sensors for their cameras, also is the source for a sensors for a number of other brands including Nikon, Fujifilm, and Ricoh/Pentax. This can have further knock on effects, causing dependent companies to have to delay new products.
Likewise, an example of a specific business case is Nikon’s recent internal re-oginizatons. While their write down wasn’t announced until January 2017, it’s reasonable to believe that have been dealing with the events that culminated in that internally for at least the latter half of 2016.
| Total ILC Shipments (CIPA) | |
|---|---|
| 2016 Monthly Avg | Jan 2017 |
| 236,756 | 153,775 |
Deriving Estimated Full Frame Sales from Total Shipments
I pointed out photosynthesis.co.nz in my previous article as a reasonable source for estimating numbers of Nikon units. According to them[5] the breakdown for FX versus DX cameras since 2013–2014, is roughly 16–20% FX 80–84% DX or DX outsells FX between about 5:1 to 6:1.
I don’t have data for any other manufacturer, but it seems like a reasonable leap of faith to expect that ratio, or something close to it, should hold across manufactures with similar kinds of product portfolios (i.e. a reasonably similar mix of full and crop frame cameras at similar price points).
Taken against the whole, the percentage of full frame cameras is further lowered by Fuji, Olympus, and Panasonic’s mirrorless offering which are all crop formats. As for Pentax, I have no idea how to predict their full frame to crop ration, but given their marketshare in Japan (4.6%) I’m not sure they’re that big of an influencing factor overall.
I’m going to hazard a guess here, again, and lower the above Nikon derived FX percentage to 12% or the market as a whole. I don’t have hard data to support this, but Fuji, Olympus and Panasonic must sell at least enough to account for a few percent depression of the ILC full frame market as a whole.
A quick aside, 12%, or 16%, end up being worse case numbers in this analysis. If Fuji et al. for more than 2% of the total ILC market in units shipped, that only depresses the number of full frame cameras being sold. As a result, it makes it even easier to do a dedicated marketing based run for a temporary position swap.
So 12% of the ~154,000 total is 18,480, split between Canon, Nikon, Sony, and Pentax for sales in the Americas.
| Estimated Full Frame ICL Shipments | |
|---|---|
| 2016 Avg | Jan 2017 |
| 28,410 – 37,881 | 14,153 – 18.453 |
18,000–20,000 cameras for January feels like a reasonable number to me, as does the 28-37 thousand range for an average for 2016 (January is a slow sales month in the US afterall). I’m not saying it’s right, but it doesn’t strike me as being absurd either.
Normalizing for the US Market
CIPA’s shipments number are not for the US market alone, but all of the Americas. As such to get a better view of the US market alone, we need to attempt to figure out the size of the US market relative to the America’s as a whole. Like most of this discussion, here again we run into lack of direct data.
Without solid data, I’m going to look at two approaches to estimate sales these will be based on GDP, and population. I don’t think either of these techniques are 100% accurate, but I think they should provide a reasonable range to possible values.
GDP is a direct measure of the value of all goods bought and sold in the reporting region. As such, it represents a best case correlation with camera sales; the population with a high GDP should have bought/sold more cameras than ones with a low GDP. However, solid data to complete this assumption doesn’t, to my knowledge, exist, and other socioeconomic factors could skew camera sales (both in volume and towards specific types/market segments) regardless of the GDP.
In any event, according to Wolfram Alpha, the total GDPD for the Americas[6] is $24.98 trillion per year. Of that, the United States accounts for $18.04 trillion per year, or 76.7%.
The other approach is estimate based on population. The underlying assumption here is that the number of serious photographers is largely invariant in the population as a whole. The obvious problem with this estimation is that socioeconomic factors may strongly depress full frame camera buyers in less economically strong nations, even if serious photographers per capita isn’t radically different.
According to Wolfram Alpha, the total population of the Americas is 974 million[7], with the United States accounting for 322 million or 33% of the total population.
| Full Frame Cameras Normalized for US Sales | |||
|---|---|---|---|
| GDP Method | Population Method | ||
| 2016 Avg | Jan 2017 | 2016 Avg | Jan 2017 |
| 21,791 – 30,870 | 14,153 – 20,050 | 9,375 – 13,281 | 6,099 – 8,262 |
Admittedly I’m not convinced that either of these extremes are accurate in and of themselves. Though I’m inclined to lean more towards the GDP estimate simply because of the nature of cameras as luxury items. Simply, you have to have a sufficient amount of disposable income to buy them outside of professional use. Given that for the sake of the rest of this discussion, I’m going to assume that somewhere around 14,000 of the estimated 18,000 cameras shipped to the Americas are shipped/sold in the US in January.
Sales per Company
Of course, now the question arrives as to what the actual volume are on a company by company basis?
Like usual, there’s precious little public data pertaining to marketshare, in the US or otherwise. I don’t even have a reasonable point to even start to form a position form.
BCN publishes marketshare information for Japan[8], but those numbers don’t necessarily translate globally, or to the US. For example, mirrorless cameras are far more popular in Japan than they are in the US[9].
But lets say just for the sake of argument those percentages translate, even though I don’t really believe they do — think of this as a reality check on the estimates being done here and a reasonably reality check on Sony’s claim.
All of Canon and Nikon’s full frame cameras are SLRs, so that makes estimating their numbers somewhat straight forward. Nearly 111,000 SLRs were shipped to the Americas in January, which, assuming Canon holds 63.3% of the marketshare, they would have shipped nearly 70,000 SLRs. Assuming Canon’s full frame breakdown is 6:1, as Nikon’s appears, that would result in about 12,000 full frame cameras. Nikon would have shipped some 35,000 cameras total, of which 5,800 would be full frame.
If we adjust for GDP (76.7%) that would imply Canon ought to have shipped around 9,204 full frame cameras, and Nikon around 4,449 full frame cameras in the US in January. That leaves, 521 un accounted for cameras in the numbers, which could be Sony SLTs and Pentax full frame bodies.
That said, I want to be perfectly clear here again about speculation and time scales. The BCN market share numbers were for SLRs and Mirrorless ILCs sales, as a whole, over all of 2016 in Japan. Aside from the markets not translating, there are problems with taking an annual value and applying it to a monthly estimate. Specifically, at a monthly or weekly level marketshare positions may fluctuate between companies. Addiontally we’re talking about such low numbers as a whole that variances are going to be significant. Keep in mind, for an estimated 18,000 cameras shipped to the US, that translates to 360 cameras per state.
Sony poses some other challenges, but it’s probably safe to assume that the bulk of Sony’s full frame sales are for their mirrorless cameras not there SLRs. However, the bigger question is does the 6:1 crop to full frame split still hold for Sony or does it fall some other way?
CIPA says manufactures in January shipped 43,000 mirrorless cameras to the Americas, so Sony’s 18.5% share would translate to about 8000 cameras. Normalizing for the US market, drops the number to around 6,136 cameras.
Now here comes the tricky part, what’s the full frame to APS-C split?
If it’s 6:1, that would be ~1,000 cameras. Not nearly enough to even be in a reasonable ballpark to make the claim they did based on sales.
2:1 gets close at 3000 mirrorless cameras (plus some of the 500 SLTs).
Discussion
My intent here was to estimate market size in units in an effort to put some scale and context to the discussion. As I keep saying there’s precious little in the way of exact information available to the public at large.
One obvious point is that my numbers as posted don’t put Sony in the numbers 2 position. I’m well aware of that. More importantly, this should not be interpreted as an accusation that Sony is lying in their press release. A large factor in my numbers was annual marketshare information from Japan, not the US (since I can’t find any).
One important aspect that will keep coming up, however, is time frames. The vast majority of industry and investors work on annual time scales — yes, shorter time scales are useful and used in some cases. However, annual time scales will average out various outliers and variances in the data. This will become especially relevant when I start talking about sales as a function of product age and time of year.
The most important aspect of this part of the discussion though is the magnitude of the market. In January 2017, we’re talking about reasonable shipments of less than around 25,000 full frame cameras total. That really isn’t a lot of units (500 per state for each of the 50 states), and ultimately that means that even a 1000–2000 units could make a significant change in apparent market share; doubly so given the rest of the circumstances that I’ll be discussing in the next sections.
The intent of this section on market size and possible sales numbers was to try to establish a rough context for most of the rest of this article, and the discussion as a whole. I’m mixing things like annual marketshare data — and for markets that I can’t establish behave the same — with mostly shipment data. The reality though is that things can fluctuate significantly on monthly time scales, and average out over a year. But this is based on the best information I have. Moreover, while I wouldn’t cite or stand by a specific number, I do stand by the general magnitude.
Rebates and Their Effects on Sales Volume
Rebates are a well established and understood tool in business that are used to alter the normal trends in product demand to something more efficient for the manufacturer. So much so that there’s quite a bit of business science around how to use them to either flatten demand curves as well as understanding how rebate drive sales can mask normal market signals (i.e. demand).
For the business offering them, rebates serve as a temporary way to trade some profits for some other desirable aspect such as marketshare growth or a smoother demand curve.
For example, Canon runs a number of fairly small (usually ≤15%) on select lenses and sometimes cameras at various periods over the course of the year. Since these rebates aren’t very large and the lenses and cameras are still quite expensive, their effect on sales will be relatively weak too. Moreover, the products on rebate frequently change from season to season. Both behaviors indicate that Canon is using the rebates to shape the demand curve for various products to insure they can optimize their production and warehousing costs.
One reoccurring point that was brought up by a myriad of posters on virtually every site running Sony’s press release was to note that Sony was running a fairly significant rebate program for a large portion of the period in question.
Sony’s Trade-in/Trade-up Rebates
From January 21 to March 4, Sony had an extensive rebate program in place for most of their full frame Alpha mirrorless camera. This program, offered a significant incentive rebate on full frame mirrorless cameras, along with a further incentive effect that the rebate was tied to trading in old camera hardware.
Sony was offering an average of 17% off on A7 bodies (up to $480) based on the purchaser trading in hardware with participating camera stores. Further, the hardware traded in was purchased as used by the participating camera store, with that sum also being returned to the owner.
This was a very effective, and honestly quite clever, rebate program on many levels.
To start with, Sony was able to make a much more enticing looking incentive while still limiting their ultimate costs. Ultimately, their costs were limited to about 17% of the camera’s retail value, while the consumer would likely see significantly more effective savings.
Additionally, they prompted users to trade in potentially their existing camera, which functionally removes competitor’s products from the inventory of people buying the new cameras. This has both knock on effects in promoting further purchases in the E-mount system as well as removing some potential to revert back to the previous system.
To put some perspective on this, I’ll use my own situation as an example. I’ve repeatedly considered purchasing a Sony A7S II primarily for the 120 FPS 1080p video capabilities. At retail (at the time of writing) the camera costs $2798. During Sony’s rebate program, the camera was running for $2698 plus a rebate value of $450 if you traded in an old camera. I have an old EOS–1D mark III that I’m not really using anymore, which carries an estimated trade in value of about $350. All told I could expect to pay about $1,898 for the camera, which is only 67% of the normal retail cost.
As far as camera rebates go, this is a very significant savings.
However, like I said, Sony was only on the hook for $450 out of my total savings. Practically speaking, $450 while slightly higher than what I’m use to seeing (more like 15%), isn’t completely out of line with the kinds of rebates that have been run on camera bodies. However, the further estimated $350 I would have pocketed, would have come from the retailer, and not out of their profits either as they would have my old camera to sell at a profit too.
Rebates from the Market as a Whole
As I noted early in this section, rebate are something manufacturers control to influenced the sale of their products. For the most part, Canon and Nikon seem to use comparative small rebates on a regular basis to insure that there’s a relatively consistent demand.
However, the bigger picture of this discussion does go back to Sony temporarily taking the number 2 position for full frame camera sales in the US. Since rebates do affect the sales volume, it’s necessary to look at what the other manufacturers were doing at the time to get a feel for what and how Sony’s rebates could have skewed the demand curves and affected marketshare reporting.
So far as I can tell, Canon wasn’t running any rebate at the time, or at least not anything significant. Most of Nikon’s rebates expired in early January, being more inline with the holiday season than after it.
Rebates v. Time
One thing that also bears some consideration is the effect of rebates on sales over time. Based on practical experience watching products sell out when rebates are in place, I would suggest that rebates tend to have a performance curve that’s biased towards the start of the rebate period. In other words, more units will sell early on then taper off instead of selling at a more consistent rate over the entire run of the rebate.
On average, people tend to move quickly to secure a product under rebate if there is good reason to believe that the products will sell out. Moreover, the more enticing the rebate is the stronger the attraction at the start of the program is likely to be.
In the case of Sony’s rebate program, it ran for only 10 days in January (32% of the month), all of February and only 4 days in March (13% of the month). However, with such good deal in place, it’s quite possible that the leading 10 days would move nearly as much product as the entire following month.
Though this is largely speculative in that I don’t know the exact behavior of these rebates on Sony’s sales, it is contributory to explain how January and February, but not March, had such great sales volume for Sony.
Rebates Accounting v. Marketing
What has to be done in done legally in terms of accounting, and how marketing can distort things are two entirely separate worlds.
Sony’s press release talked about sales volume in dollars not units. One broad implication of this is that Sony may not have shipped more units than Nikon or Canon, but sold more in dollars. Which statistics is more important to any given person/investor is an open question.
However, sales in dollars does leave some room to potentially “game” the numbers. Rebates, not accounted for in the market research data artificially infects the sales in dollars compared to what was actually sold. Of course, in the case of Sony’s trade up rebates, there is also the value of the camera traded in, which almost certainly isn’t factored into the market research Sony is citing.
In accounting, the most broadly accepted way of accounting for rebates is as a separate entry (loss) booked against the sales revenue (income). From the accounting perspective, the camera is accounted for selling at normal distributor’s price at the time it was sold to the retailer. This will not be the price the consumer pays either, it will be the price the distributor paid at the time they bought the camera. Then a separate entry for a loss of the rebate value is created against the revenue from sales.
Of course, accounting, market research, and marketing are all separate things, and it’s entirely unclear how the market research and marketing are accounting for the rebates as it relates to sales and marketshare.
Moreover, Sony’s press release makes no indication of the active rebate program or how the rebates were accounted for, either by them or NPD. Further, a search both on NPD’s site and around the web, suggests that NPD does track rebates, or at least rebate claim rates, I couldn’t find any disclosure on how they account for rebates when determining marketshare by sales.
That said, the rebates alone amounted to about 17% for the cameras in question. If they weren’t accounted for in the sales figures, then the sales figures would report about a 17% higher sales in dollars than what actually was sold.
I’m making this point because of how rebates affect the actual market value of a product. Their enticement is literally because they are decreasing the cost of the item to the consumer, which makes it a better value (as in deal) for the consumer which pushes more people into the buy category.
Annual Sales Cycles
Previously I alluded to the idea that Sony may have been exploiting annual sales patters to make a marketing driven push during an otherwise low volume time period. If Sony’s marketing was attempting to make their position seem stronger than it otherwise was, that could aid in their efforts. Again, the lower the absolute volume the fewer units it takes to over take another company. This certainly seems to be the case based on CIPA shipment data.
First, lets start with an overall look at the monthly shipments for the Americas from CPIA data. The following charts are based on CIPA shipments to the Americas from 2012 to 2016 for interchangeable lens cameras only (SLRs and mirrorless). The first chart shows each years’ trends plus an average trend line from all the years. The second shows the minimum and maximum variances for each month from any year, as well as the average.
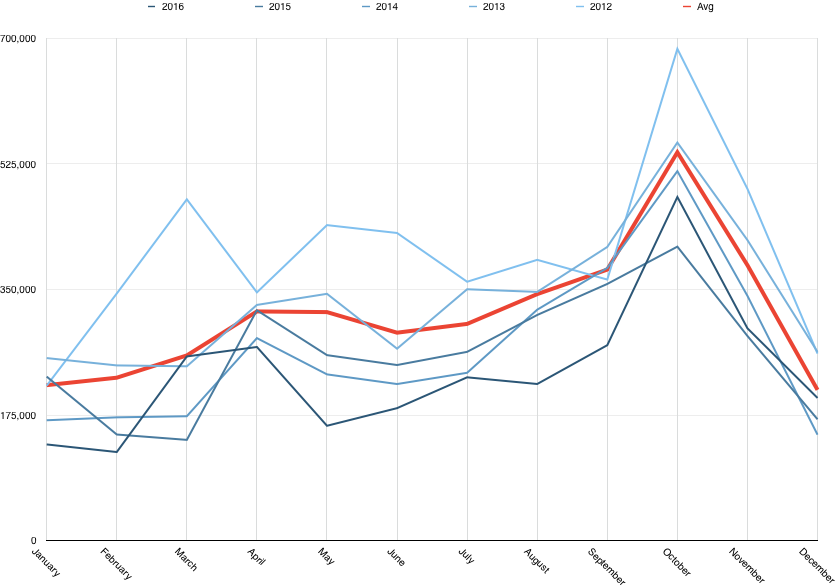
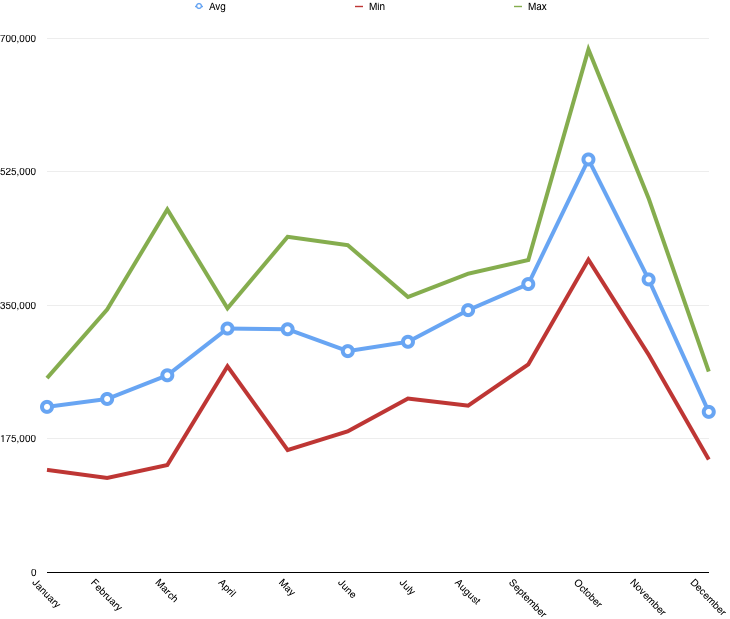
There are two clear peaks in shipments that consistently come up year after year. There’s a relatively small one in the spring, somewhere around April. Followed by a second much larger one in the fall in October.
Sony’s rebates fell nicely in the annual low shipment period, and as an implicit result sales period, for the camera makers. That would have certainly limited the total volume, drawing all the competitors closer to gather and making it easier (fewer units would need to be sold) to cover ground or overtake.
Further Questions
While not related to Sony’s press release, looking at the CIPA data did raise a number of additional questions for me.
- How pronounced is the US holiday season seen in camera sales versus other regions?
- How strongly does the holiday buying season influence high-end/full frame camera sales?
- Can trends be spotted that correlate to new product release?
- Can possible leads times be estimated?
- Such that major product announcements can be predicated by looking at pre announcement shipment data or do camera makers insure that their announcements precede the start of their shipments.
I’m not going to delve into these questions, though I am considering looking at least the fist 2 in a separate investigation.
Product Sales Volume v. Model Age
One of the lines of thought that I’ve been developing is the idea that Sony may have timed things strategically based on the alignment of market weakness of the competition. Their rebates were already time with a period of the year where cameras shipped in their lowest volumes. But there’s a second factor with respect to volume, and that’s the volume of sales versus the age of the product line.
Completely analyzing the demand curves for durable goods like consumer electronics, and specifically high end DLSRs, is well beyond the scope of this article. However, there are some reasonable common sense like points that can be applied.
Digital cameras are durable goods. That is they don’t wear out, or are consumed, over a short period of time. Yes, the shutter for example will eventually fail, but that shouldn’t be for 100s of thousands of cycles in the classes of cameras we’re talking about there. Because durable goods aren’t readily consumed, the demand over time isn’t constant the way it generally is for say something like film, or bread. Further, the classes of cameras we’re talking about in this article have long product cycles; typically more than 2 years.
Finding a good proxy product with detailed enough sales information has been nearly impossible. For one thing, most people talking about sales are talking about in the investing context. That means that data is at bets in quarter sized chunks. For many products, quarters simply don’t provide enough information to really develop a demand curve. Either the models turn over fast enough (yearly) that you don’t have a picture of the long tail, or the data is too obscured to really be useful.
With the lack of a good proxy product, I’m going to make something of a common sense assertion. Long cycle durable goods will see strong sales near their release, with declining sales over the long tail of the life cycle towards replacement. Something like the following graph.
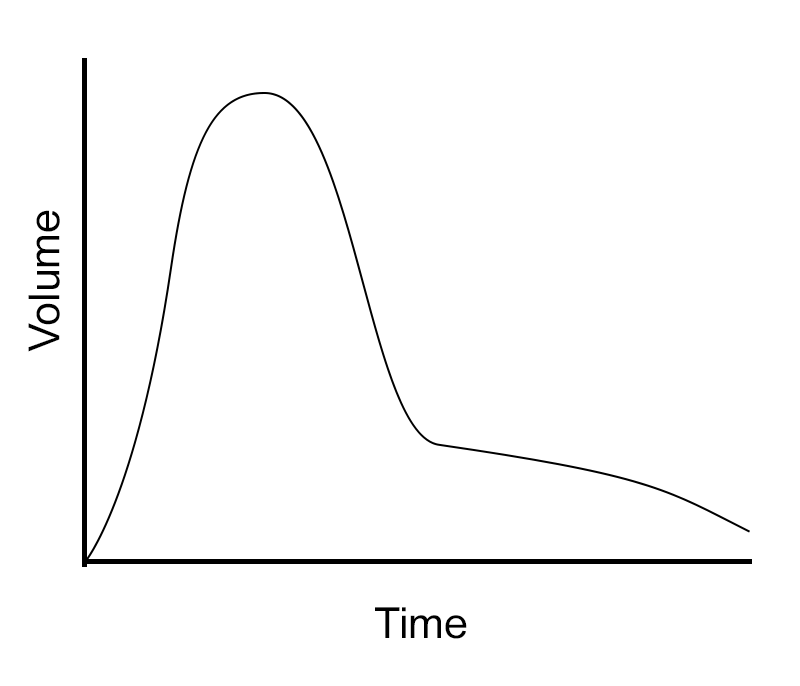
I’m not, however, making a claim as to the strength or exact shape of the curve, just the general shape.
So let me bring this back to Sony’s press release now. Early 2017 had a second interesting oddity in the camera world. The vast majority of Nikon’s full frame cameras are quite old. The newest full frame camera they had available at the time was the D5, which is an extremely niche product that sells in very small volumes (est. <5000 units in the first year or so). The rest of the full frame product line has been on the market since 2013–2014 (D810, D750, D610 and Df).
My assertion based on product life cycle is that sales would be relatively depressed for Nikon’s full frame cameras as a result of this. Many people would have already upgraded, those that didn’t would likely be willing to wait for an upgraded replacement. New users (which is something of a tricky point for a number of reasons) and people replacing damaged/destroyed cameras would make up the bulk of the active sales. That would be a relatively small group compared to the people upgrading early in the product’s life cycle.
On the other hand, Canon’s full frame product line comparatively much newer. The 5D mark IV was released in mid 2016 (and frankly was likely to still be in, or just coming off, the early adoption phase), the 5Ds was released in mid 2015. The only truly old Canon full frame body is the 6D, which dates back to late 2012. At least one of Canon’s full frame options is still quite new, and another isn’t so old that it’s starting to look antiquated.
Conclusions
I want to repeat again, I’m not writing this as an attempt to criticize Sony or anything of the sort. Though their press release was the impetus for this post, my main interest was looking at the market situation and scale.
That said, I’m not personally convinced that Sony’s position is as significant as they have implied. It’s certainly true that they have to have grown a baseline marketshare that’s big enough to put them in position to be able to do what they’ve done.
However, there certainly appear to be market factors at work as well. Nikon was in an unusually weak position with the bulk of their current full frame line being fairly old and likely selling at much lower volumes as a result. More over, Sony’s rebates provided a very strong incentive to purchase a Sony MILC, especially if you had something to trade in.
Yet again, I think the biggest takeaway from the whole discussion is just how little actual data is available to make any kind of informed and reasoned commentary. Even something as simple as marketshare data is virtually nonexistent without being a manufacture or having significant financial resources to throw at market research data.
I also want to reiterate a point in taking this entire post with a big heap of salt too. While I’ve researched, as best as I can, everything I’ve talked about, and laid out my assumptions when I guess, this is no way should be considered authoritative. Even what I consider the most well grounded and supported section, full frame sales volume in the US, still is riddled with assumptions and incomplete data.
- Sony USA Press Release ↩
- Olympus Corporation, CASIO COMPUTER CO.,LTD., Canon Inc., Xacti Corporation, SIGMA CORPORATION, Sony Corporation, Nikon Corporation, Panasonic Corporation, FUJIFILM Corporation, Ricoh Company, LTD. Source: CIPA Reporting Member List. ↩
- Yes, shipped is not the same as sold. ↩
- Ford January Sales Report ↩
- Tabulated data since ~2013:
Camera Est Units % Format % Total D5 1000 0.5 0.1 D4s 28,000 13.1 2.2 D810 43,000 20.1 3.4 Df 6000 2.8 0.5 D750 86,000 40.2 6.8 D610 50,000 23.4 4.0 FX 214,000 16.9% D500 11,000 1.0 0.9 D7200 53,500 5.1 4.2 D7100 127,000 12.1 10.1 D5500 21,000 2.0 1.7 D5300 304,000 29.0 24.1 D3400 283,000 27.0 22.4 D3300 225,000 (guess/no available data) 21.4 17.8 D3200 25,000 2.4 2.0 DX 1,049,500 83.1% Source: Nikon cameras page ↩
- [GDP for the Amercias][] ↩
- Population of the Americas ↩
- SLR: Canon 63.3%, Nikon 31.6%, Ricoh 4.8%; Mirrorless: Olympus 26.8%, Sony 18.5%, Canon 17.9% ↩
- Jan 2017, Japan shipemnts: 43,080 mirrorless, 41,358 SLRs; Americas shipments: 43,068 mirrorless, 110,707 SLR Src: CIPA January Report. ↩
Comments
There are no comments on this article yet. Why don't you start the discussion?